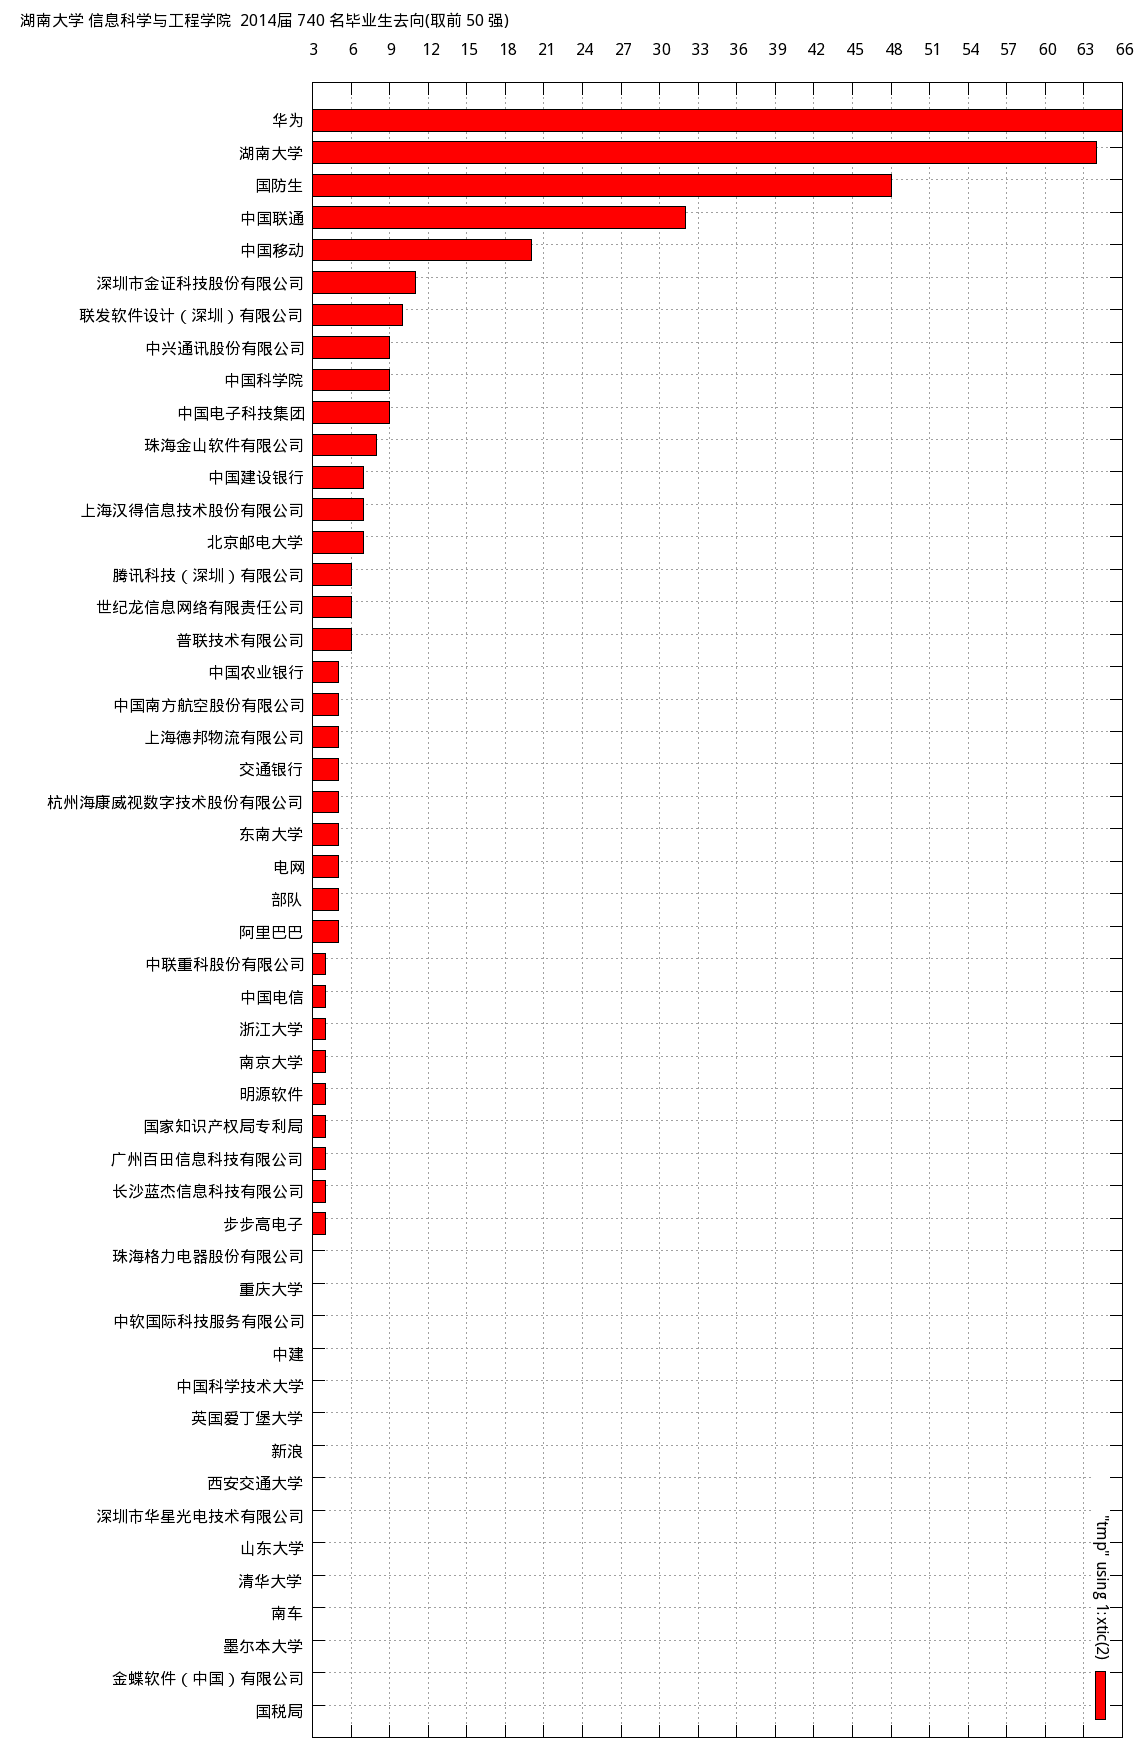
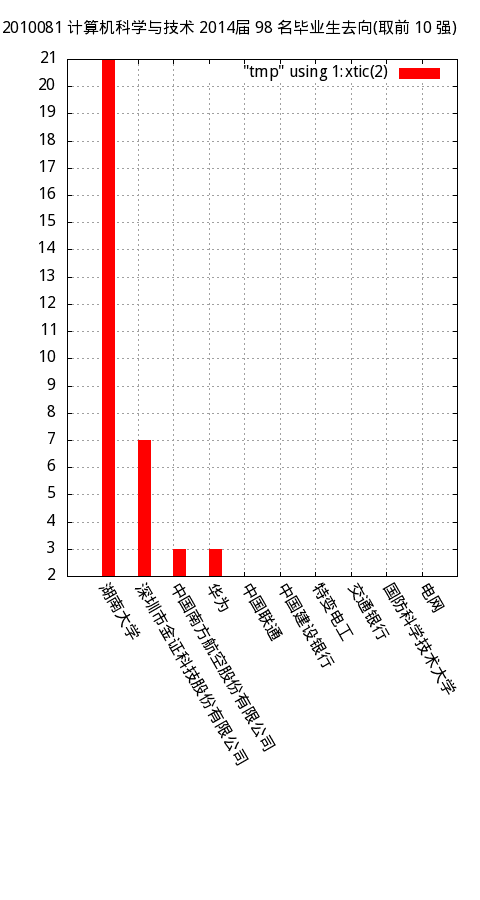
前些天发现就业网公布了14届毕业生去向统计表,刚好想学gnuplot,心血来潮要把统计表做成图片。
xls转csv
首先要做的是将xls格式转换成便于脚本处理的csv格式。一开始使用excel另存。后来发现Linux上有可用的工具(可惜没成功,貌似是编码的问题,这里仅记录一下软件安装)。添加epel源后可用直接安装。
epel详见http://mirrors.fedoraproject.org/publiclist/EPEL/。选择一个国内的安装:
rpm -ivh http://mirrors.yun-idc.com/epel/6/x86_64/epel-release-6-8.noarch.rpm
yum search查询xls2csv
[root@HADOOP-219 hnu-graduates]# yum search xls2csv
Loaded plugins: fastestmirror, priorities
Loading mirror speeds from cached hostfile
 * epel: ftp.sjtu.edu.cn
======================================== Matched: xls2csv =========================================
catdoc.x86_64 : A program which converts Microsoft office files to plain text
之后yum安装catdoc即可。
另外有些文章和软件可以参考一下:
- http://leslie-chu.blog.163.com/blog/static/199863243201263935085/
- xls2doc
处理csv文件
根据关键词获取具体去向。关键词从命令行参数获取。支持以学号为关键词,但是为了好理解会附加一个变量即ADD_KEY。当KEY为数字的时候,取专业那一列作为ADD_KEY。
if [ $# -eq 2 ];then
	if [ $2 -lt 500 ];then
		SHOW_NUM=$2
		KEY=""
	else
		 KEY=$2
		SHOW_NUM=0
	fi
else
	KEY=$2
	SHOW_NUM=$3
fi
FILE="hnu2014.csv"
REPLACE="replace.dat"

OUT=$KEY.csv
[ "$KEY"x == ""x ] && OUT=all.csv

COMPANY=$KEY.txt
[ "$KEY"x == ""x ] && COMPANY=all.txt

PIC=$KEY
[ "$KEY"x == ""x ] && PIC=all


echo >$COMPANY
grep "$KEY" $FILE >$OUT

echo $KEY |grep -E "[0-9]" && ADD_KEY=`grep $KEY $FILE |awk -F "," '{print $4}' |sort |uniq -c |sort -n -r | awk 'NR==1{print $2}'`

TOTAL=`wc -l "$OUT" |awk '{print $1}'`
TITLE="湖南大学 $KEY $ADD_KEY 2014届 $TOTAL 名毕业生去向(取前 $SHOW_NUM 强)"
FONTS="/usr/share/fonts/wqy-microhei/wqy-microhei.ttc"
去向不区分派遣升学和回原籍灵活就业,所以 报到证开具单位、到人才备注单位和回原籍备注单位统一处理,具体规则是,默认以报到证开具单位为去向,如果到人才备注单位或者回原籍备注单位不为空,则去向用它们的值覆盖。
function func()
{
	company=`echo $id | awk -F "," '{print $7}'`
	r_company=`echo $id | awk -F "," '{print $8}'`
		[ "$r_company"x != ""x ] && company=$r_company
	p_company=`echo $id | awk -F "," '{print $9}'`
		[ "$p_company"x != ""x ] && company=$p_company
	echo $company >>$COMPANY
	sleep 3
}
为了加快处理速度,模拟一个多线程。
tmp_fifofile=/tmp/$ $.fifo #$ $之间本无空格,高亮插件bugs不支持无空格形式
mkfifo $tmp_fifofile
exec 6<>$tmp_fifofile
rm $tmp_fifofile
for [1]i=0;i<$thread;i++;do
echo
done >&6
while read id;do
read -u6
{
func
echo >&6
} &
done < $OUT
wait
exec 6>&-
对具体去向进行处理, 主要是统一去向名称和去重计数及排序。
file=$COMPANY
#sed -i "/^$/d" $REPLACE
while read id
do
	echo $id |grep -E "#|^$" && continue
	search=`echo $id |awk '{print $1}'`
	replace=`echo $id |awk '{print $2}'`
	if [ "$replace"x == ""x ];then
		sed -i "s/$search//g" $file
	else
		sed -i "s/.*$search.*/$replace/g" $file
	fi
done<$REPLACE

sed -i '/^$/d' $file
sed -i 's/\ //g' $file
sed -i "s/\(.*银行\).*行.*/\1/g" $file
sed -i "s/\(.*公司\).*公司/\1/g" $file
sed -i "s/\(.*公司\).*研究所/\1/g" $file
sed -i "s/\(.*银行\).*/\1/g" $file
sed -i "s/\(.*集团\).*/\1/g" $file
sed -i "s/\(.*局\).*/\1/g" $file
sed -i "s/\(.*大学\).*学院.*/\1/g" $file
sed -i "s/中国\(香港.*\).*/\1/g" $file
sed -i "s/.*香港\(香港.*\).*/\1/g" $file
sed -i "s/.*美国\(美国.*\).*/\1/g" $file
sed -i "s/.*英国\(英国.*\).*/\1/g" $file
sed -i "s/.*日本\(日本.*\).*/\1/g" $file
sed -i "s/.*澳大利亚\(澳大利亚.*\).*/\1/g" $file

cat $file |sort |uniq -c |sort -n -r >all.tmp
统一名称主要基于一个替换规则文件$REPLACE,文件的格式如下。第二列为空的表示删除第一列。
#研究生相关
保送
考取
博士生
研究生
中国科学院 中国科学院
中科院 中国科学院
中国科技大学 中国科学技术大学
中国科学技术大学 中国科学技术大学


#部队及国家机关
军区 部队
信部
气象局 气象局
海事局 海事局


#信科院
联合网络通信 中国联通
用gnuplot画图
想用饼图,搜了之后得知gnuplot不支持饼图,只好用柱状图了。
gnuplot<<EOF
set term png size $WIDTH,$HIGHT font "$FONTS,$FONTSIZE px"
set output "./img/$PIC-h.png"
set style data histograms
set grid
set title "$TITLE" offset graph -$OFFSET
set style fill solid 2.00 border
set xtic rotate by 300
set ytics $MOST
plot "tmp" using 1:xtic(2)
EOF
其中set style data histograms就是指定画柱状图。
在这里折腾时间比较长的标题的偏移。一开始做的是水平的柱状图,图片很宽,不容易看到标题,需要把标题移动到左边。但是offset默认单位是character,不能明确的指定位置。经过长时间的搜索和调试,发现以graph为单位时比较容易控制。
gnuplot> help coordinate
 The commands `set arrow`, `set key`, `set label` and `set object` allow you
 to draw something at an arbitrary position on the graph.  This position is
 specified by the syntax:

       {<system>} <x>, {<system>} <y> {,{<system>} <z>}

 Each <system> can either be `first`, `second`, `graph`, `screen`, or
 `character`.

 `first` places the x, y, or z coordinate in the system defined by the left
 and bottom axes; `second` places it in the system defined by the second axes
 (top and right); `graph` specifies the area within the axes---0,0 is bottom
 left and 1,1 is top right (for splot, 0,0,0 is bottom left of plotting area;
 use negative z to get to the base---see `set ticslevel`); `screen`
 specifies the screen area (the entire area---not just the portion selected by
 `set size`), with 0,0 at bottom left and 1,1 at top right; and `character`
 gives the position in character widths and heights from the bottom left of
 the screen area (screen 0,0), `character` coordinates depend on the chosen
 font size.
graph已图片左下角为 0,0,右上角为 1,1,根据图片宽度及字体大小(12pt的字体大概宽16px),测算偏移量。一般越宽的图片偏移量越大。下面代码中WIDTH是图片宽度。
OFFSET=`echo $WIDTH |awk '{print 0.5-16*10/$WIDTH}'`
Convert转换图片
为了便于在网上发布,想要做成垂直的柱状图,gnuplot没有找到方法,就用convert旋转图片(需yum安装ImageMagick)。
gnuplot<<EOF
set term png size $WIDTH,$HIGHT_V font "$FONTS,$FONTSIZE px"
set output "./img/$PIC-v.png"
set boxwidth 2 absolute
set style data histograms
set grid
#set title "$TITLE" offset graph -$OFFSET
set style fill solid $MOST border -1
set xtic rotate by 90
set xtic offset 1,0
set ytic rotate by 90
set ytics $MOST
plot "tmp" using 1:xtic(2)
EOF
这时折腾很久的gnuplot的offset就难排上用场了,调来调去总是不能满意。好在convert命令可以添加文字注释。convert的坐标大概是已像素为单位,做上角为0,0,往右往下增加。于是确定添加TITLE的位置为:
TITLE_OFFSET=160 [2]RESIZE_ORIGIN=$TITLE_OFFSET-20 [3]R_WIDTH=$HIGHT_V-$RESIZE_ORIGIN
然后坐标也需要旋转,横坐标为公司名称,逆时针旋转90度后和柱图有些错位,因此将横坐标右移一个1符的偏移量:
set xtic rotate by 90
set xtic offset 1,0
convert旋转并添加标题注释。
convert -rotate 90 img/$PIC-v.png img/$PIC-v.png.tmp
convert -font $FONTS -pointsize 16 -draw "text $TITLE_OFFSET,26 '$TITLE'" img/$PIC-v.png.tmp img/$PIC-v.png && rm -f img/$PIC-v.png.tmp
旋转后图片左边留白太多,剪切掉。
convert -crop "$R_WIDTH x$WIDTH+$RESIZE_ORIGIN+0" img/$PIC-v.png img/$PIC-v.png.tmp && mv img/$PIC-v.png.tmp img/$PIC-v.png
结果展示
垂直图
水平图


发表回复